Downstream Analysis
scGNN can effectively impute scRNA-Seq data and accurately predict cell clusters.To assess the imputation and cell clustering performance of scGNN, four scRNA datasets (i.e., Chung, Kolodziejczy, Klein, and Zeisel) with gold-standard cell type labels are chosen as the benchmarks.
Imputation performance of scGNN
The median L1 distance between the original dataset and the imputed values for these corrupted entries were evaluated to compare scGNN with MAGIC, SAUCIE, SAVER, scImpute, scVI, DCA, and DeepImpute.
- The L1 distance (the lower the better) and cosine similarity (the higher the better) comparing a 10% leave-out test between scGNN and seven imputation tools on the Klein and Zeisel datasets. scGNN achieved the best scores in both datasets, indicating its superior performance in gene expression recovery (Figure 3A).
- Co-expression patterns can be addressed more explicitly after applying scGNN on the Klein data. No clear gene pair relationship of Ccnd3 versus Pou5f1 (upper panel) and Nanog versus Trim28 (lower panel) is observed in the raw data (left) compared to the observation of unambiguous correlations within each cell type after scGNN imputation (right) (Figure 3B).
- Comparison of DEG logFC scores using the original expression value (x-axis) and the scGNN imputed expression values (y-axis) identified in Day 1 cells of the Klein data (up) and Microglia cells of the Zeisel data (bottom). The differentiation signals are amplified after imputation (Figure 3C).
- The relationships of four more gene pairs are also enhanced. Comparison of gene co-expression relationships in the Klein dataset.Different colors indicate cell clusters given in the original paper (Day 1, 2, 7, and 9) (Figure S3).
- In the Zeisel dataset, scGNN amplifies differentially expressed genes (DEGs) signals with a higher fold change than the original, using an imputed matrix to confidently depict the cluster heterogeneity (Figure 3C and Figure S4).
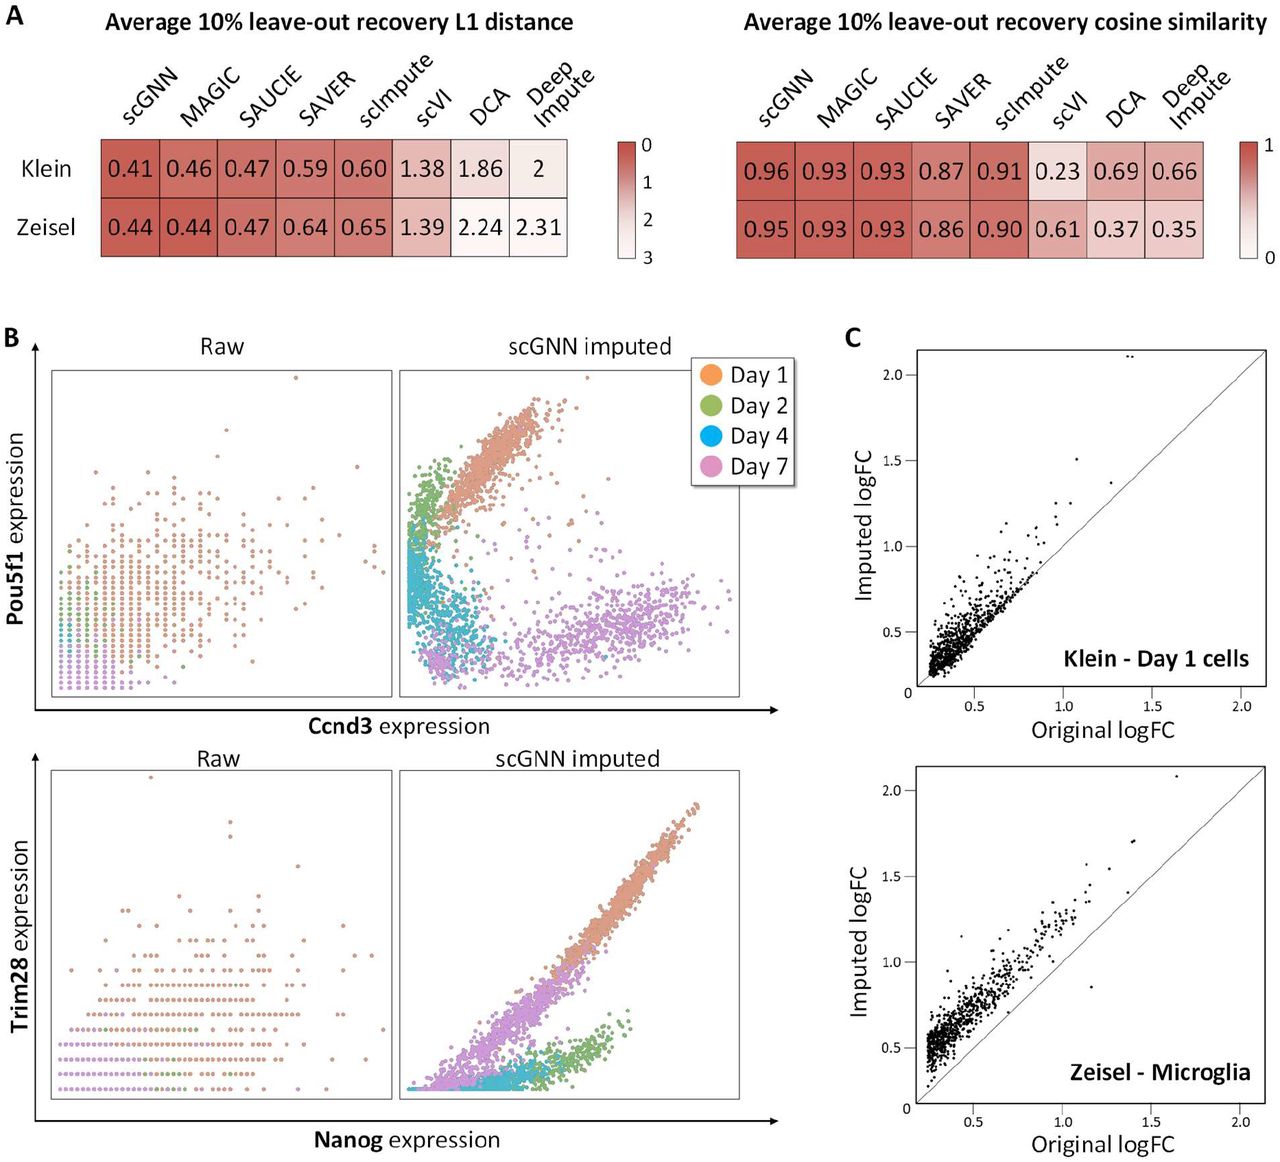
Figure 3. Comparison of the imputation performance.
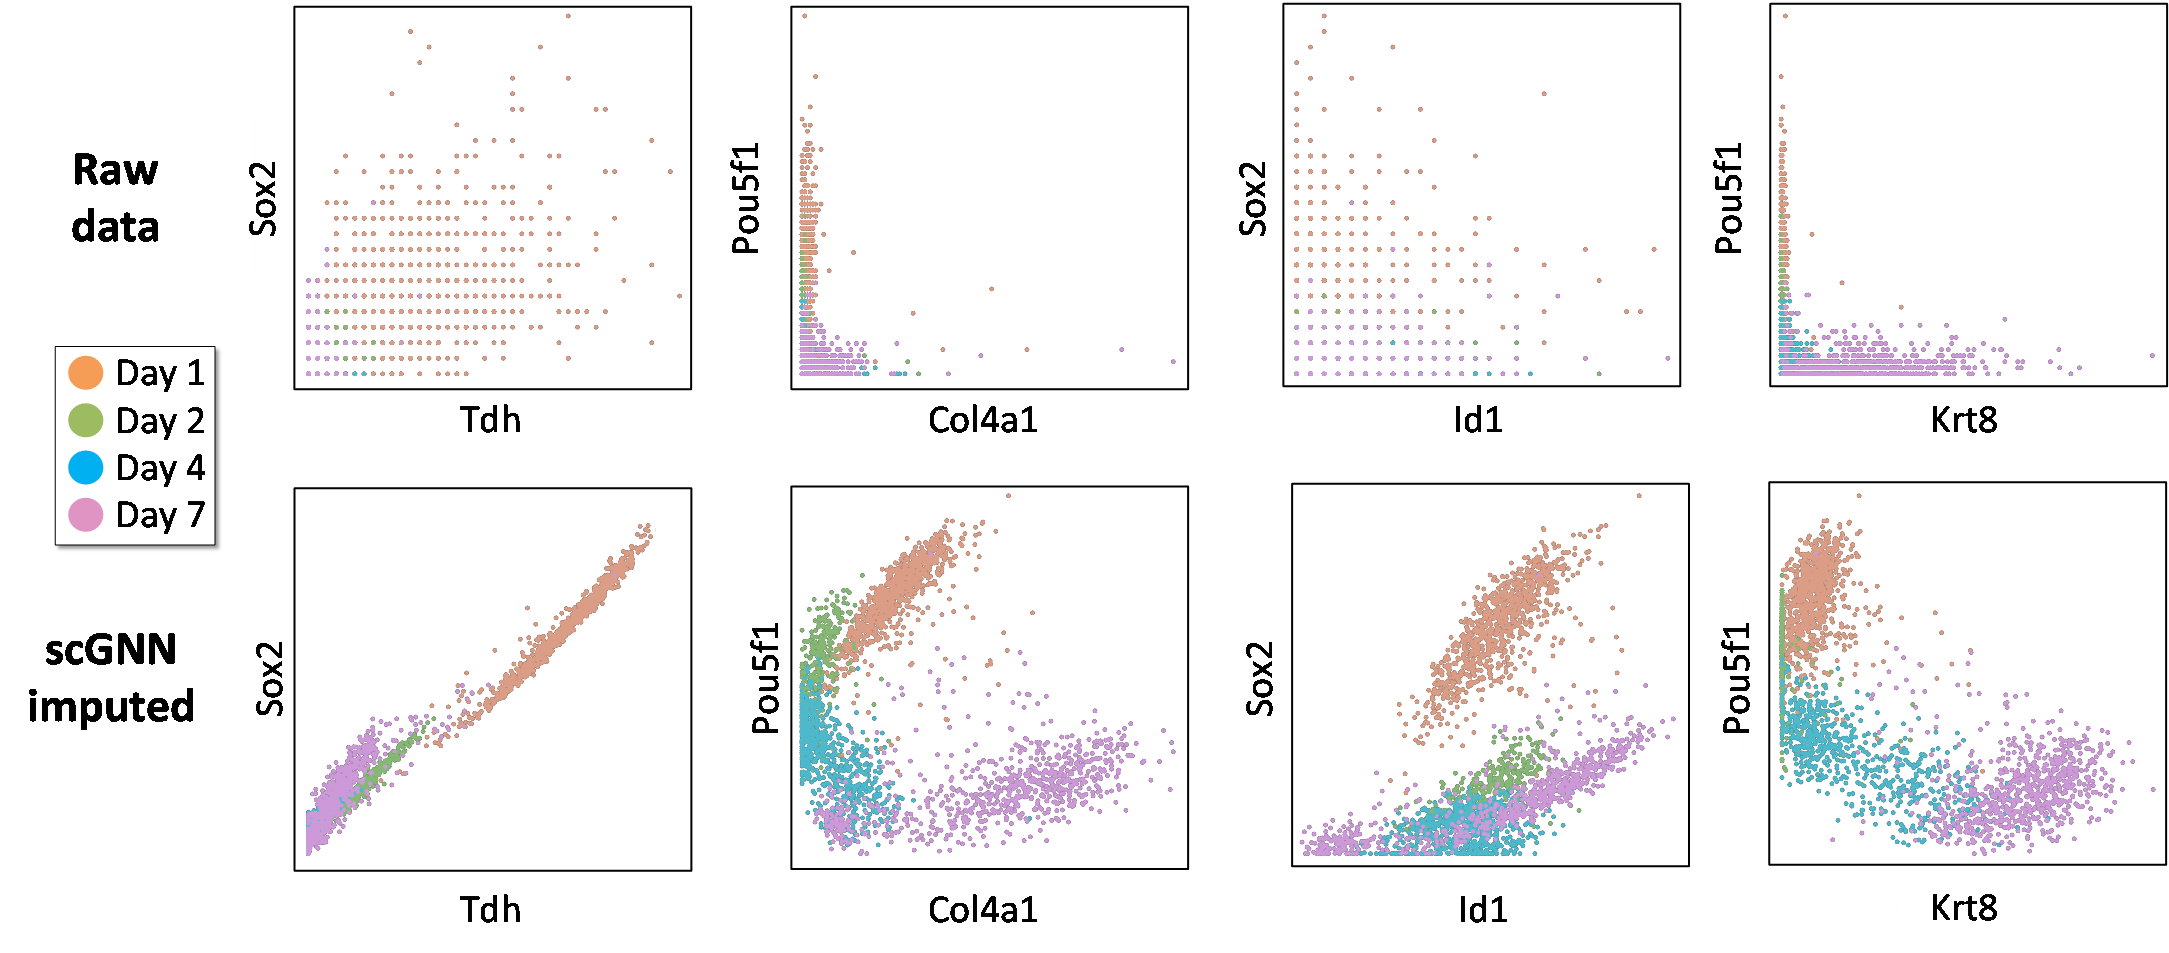
Figure S3. Comparison of gene co-expression relationships in the Klein dataset.
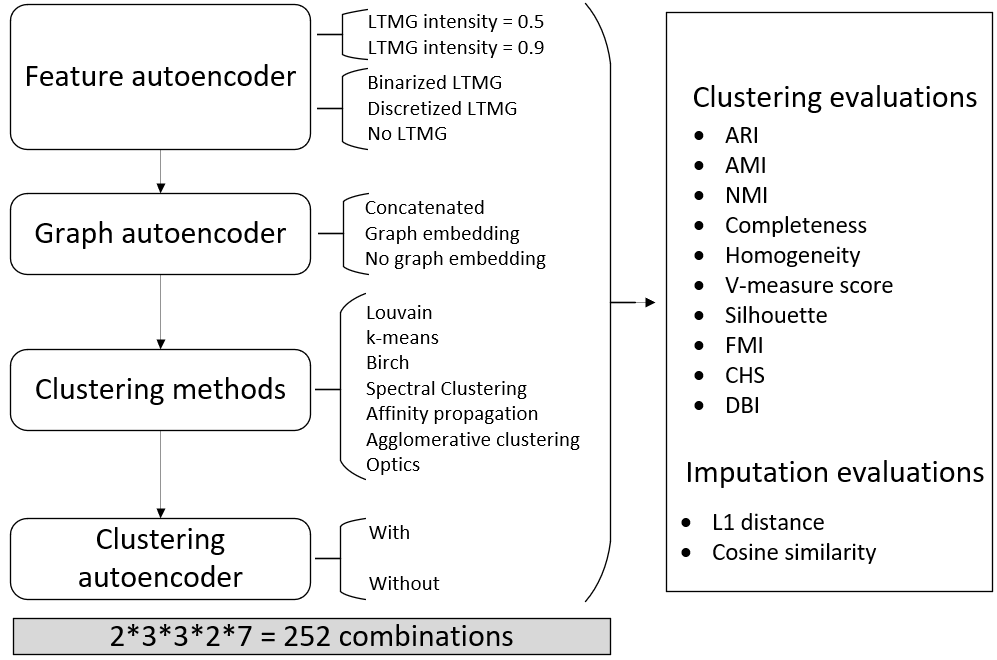
Figure S4. Design of ablation tests and parameter searching of scGNN.We tested 252 parameter combinations in scGNN for the three autoencoders in the iterative process to select the best scGNN performance. All results are evaluated via ten criteria for clustering and two for imputation.
Cell clustering results of scGNN
Besides the artificial dropout benchmarks, we continued to evaluate the clustering performance of scGNN and the seven imputation tools on the same two datasets.
Cell clustering and trajectory evaluations
- Comparison of ARI and Silhouette scores among scGNN and seven tools using Klein and Zeisel datasets (Figure 4A).
- Comparison of UMAP visualizations on the same two datasets, indicating that when scGNN embeddings are utilized, cells are more closely grouped within the same cluster but when other tools are used, cells are more separated between clusters. Raw data is clustered and visualized using Seurat (Figure 4B).
- Pseudotime analysis using the raw expression matrix and scGNN imputed matrix of the Klein dataset via Monocle2 (Figure 4C).
- Justification of using the graph autoencoder, the cluster autoencoder, and the top 2,000 variable genes on the Klein dataset in the scGNN framework, in terms of ARI. scGNN CA-shows the results of the graph autoencoder’s ablation, CA-shows the results of the cluster autoencoder’s ablation, and AG shows the results after using all genes in the framework (Figure 4D).
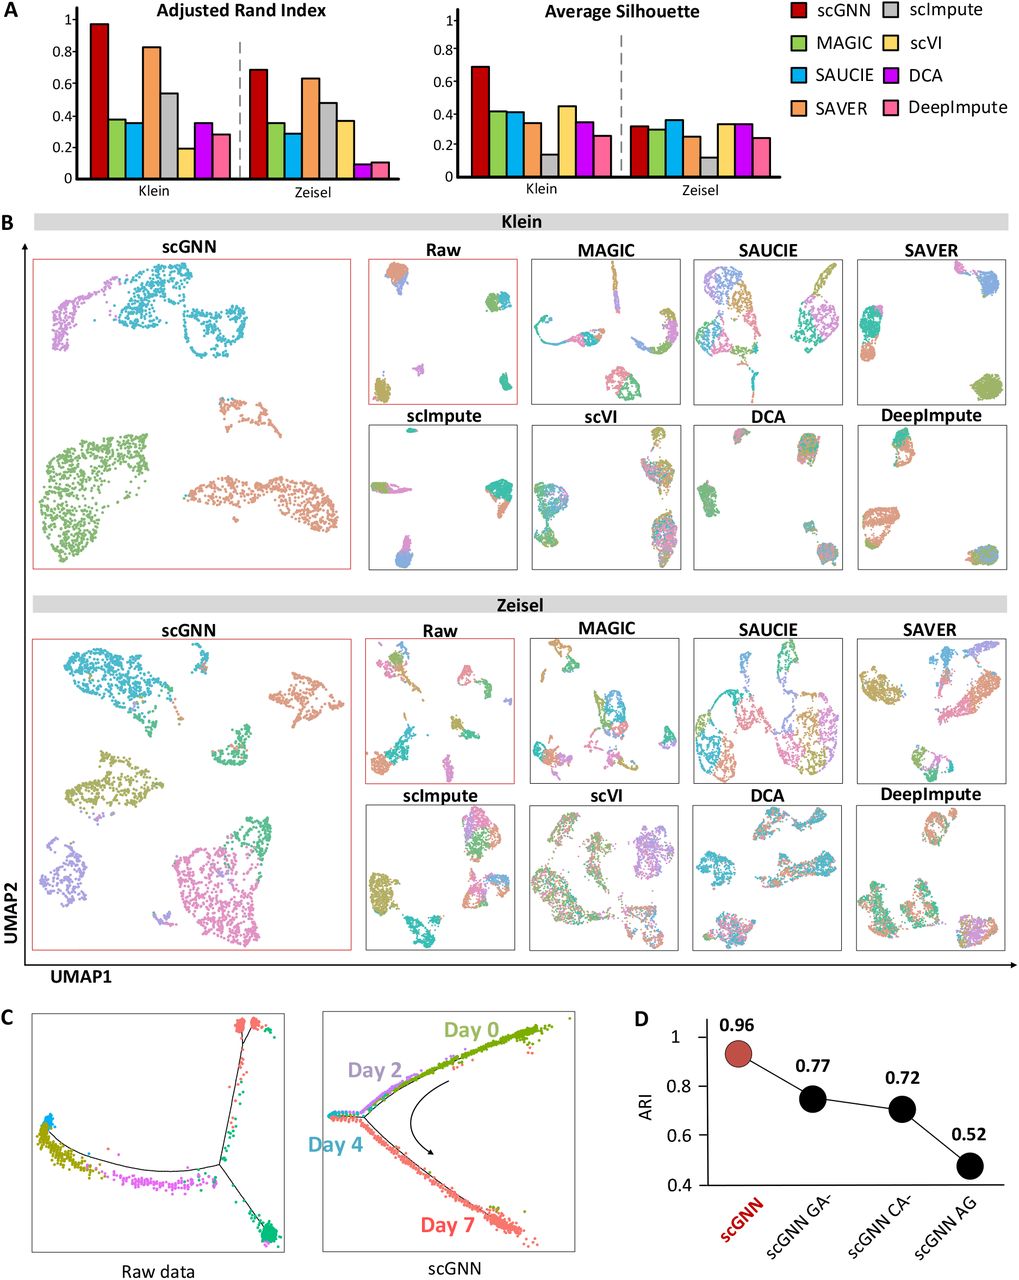
Figure 4. Cell clustering and trajectory evaluations.
Cell clustering results of scGNN compared to existing clustering tools
scGNN showed significant enhancement in cell clustering compared to the clustering tool (e.g., Seurat) when using the raw data. The comparison was conducted on four tools (i.e., Seurat, CIDR, RaceID, and Monocle3) using four benchmark datasets. ARI of each test is indicated on each UMAP, comparing the predicted cell clusters to the benchmark labels.
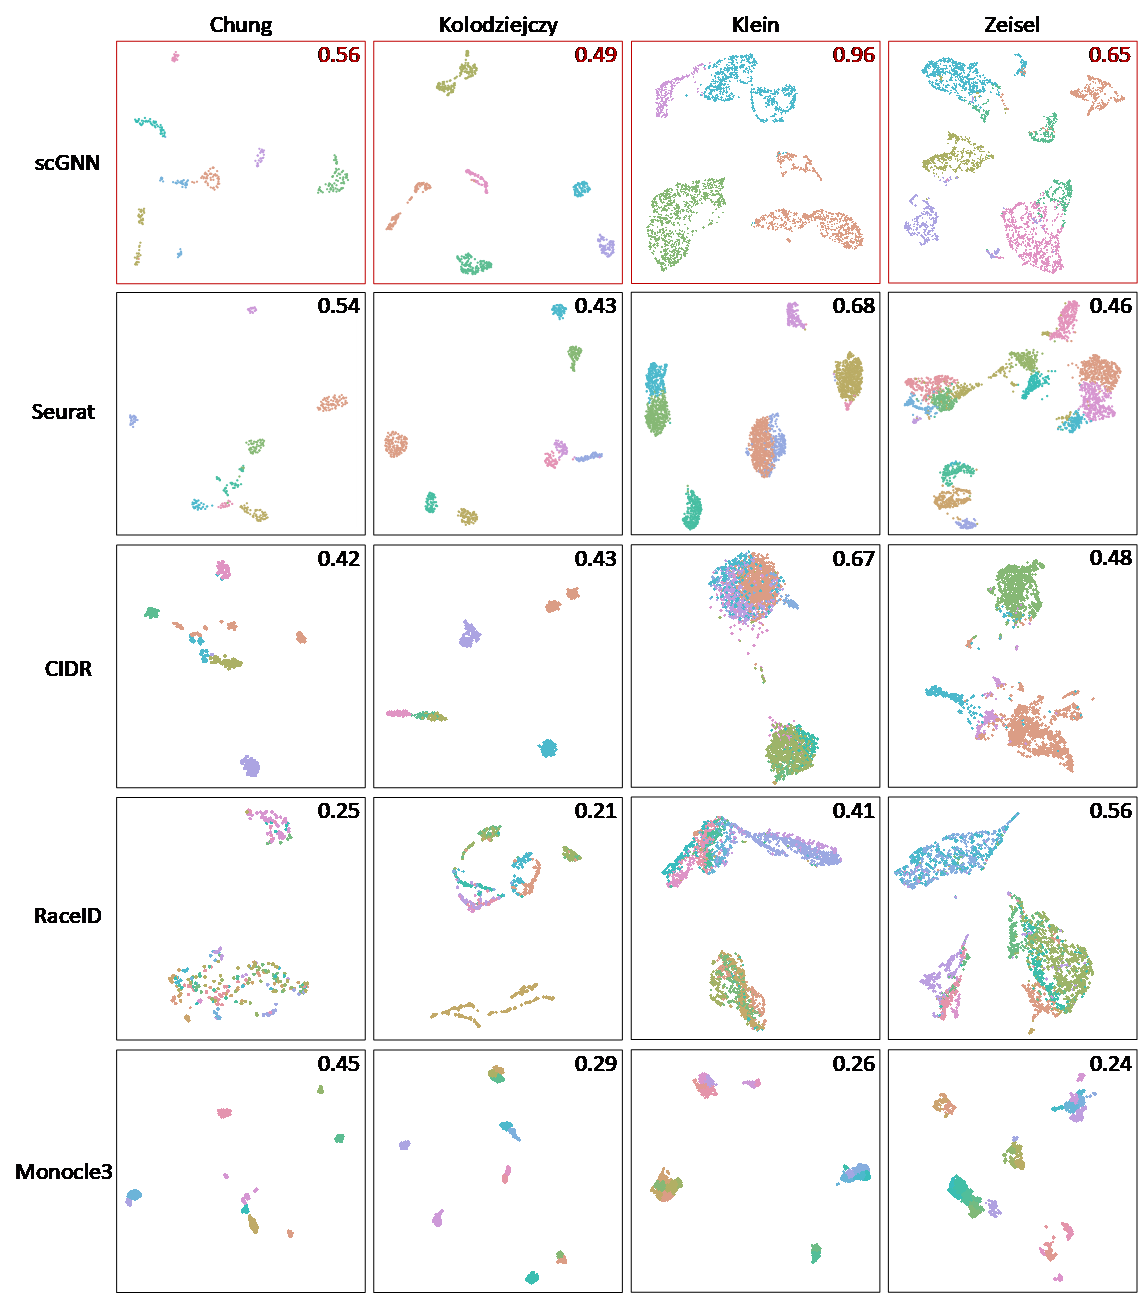
Figure S5. Clustering results of scGNN compared to existing clustering tools.
scGNN illustrates AD-related neural development and the underlying regulatory mechanism
To further demonstrate the applicative power of scGNN, we applied it to a scRNA-Seq dataset (GEO accession number GSE138852) containing 13,214 single nuclei collected from six AD and six control brains. scGNN identifies 10 cell clusters, including microglia, neurons, oligodendrocyte progenitor cells (OPCs), astrocytes, and six sub-clusters of oligodendrocytes (Figure 5A). Specifically, the proportions of these six oligodendrocyte sub-clusters differ between AD patients (Oligos 2, 3, and 4) and healthy controls (Oligos 1, 5, and 6) (Figure 5B). Moreover, the difference between AD and the control in the proportion of astrocyte and OPCs is observed, indicating the change of cell population in AD patients compared to healthy controls (Figure 5B). We then combined these six oligodendrocyte sub-clusters into one to discover DEGs. Since scGNN can significantly increase true signals in the raw dataset, DEG patterns are more explicit (Figure S6). Among all DEGs, we confirmed 22 genes as cell-type-specific markers for astrocytes, OPCs, oligodendrocytes, and neurons, in that order35 (Figure 5C). A biological pathway enrichment analysis shows several highly positive-enrichments in AD cells compared to control cells among all five cell types. These enrichments include oxidative phosphorylation and pathways associated with AD, Parkinson’s disease, and Huntington disease36 (Figure 5D). Interestingly, we observed a strong negative enrichment of the MAPK (mitogen-activated protein kinase) signaling pathway in the microglia cells, suggesting a relatively low MAPK regulation in microglia than other cells.
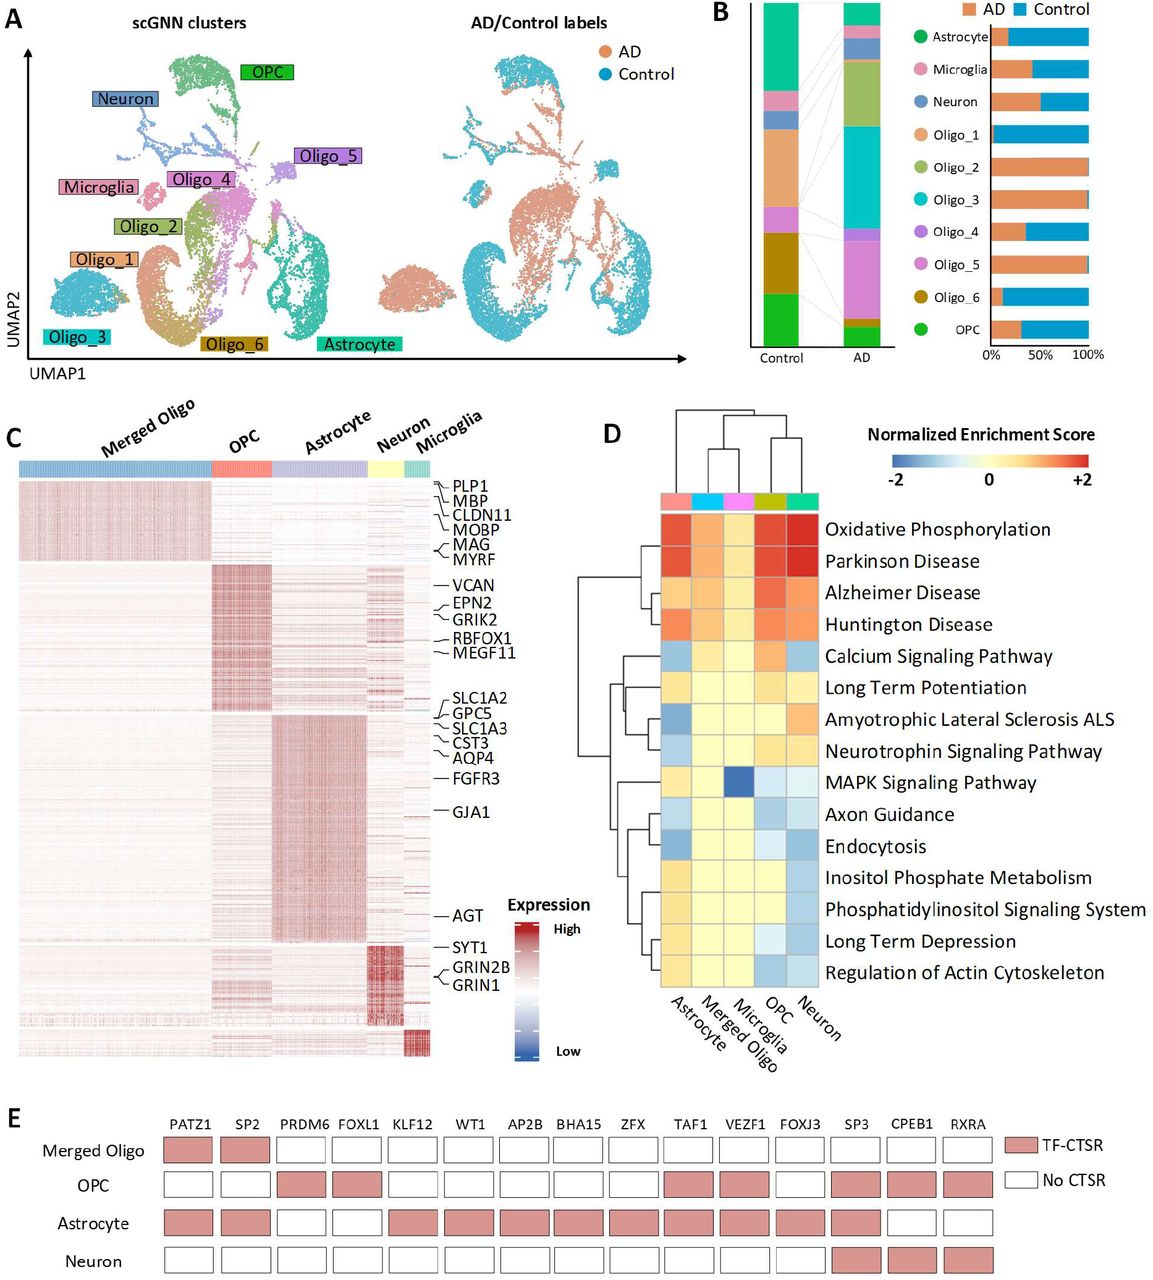
Figure 5 Alzheimer’s disease dataset (GSE138852) analysis based on scGNN. (A) Cell clustering UMAP. Labeled with scGNN clusters (left) and AD/control samples (right). (B) Comparison of cell proportions in AD/control samples (left) and each cluster (right). (C) Heatmap of DEGs (logFC > 0.25) in each cluster. Six oligodendrocyte sub-clusters are merged as one to compare with other cell types. Marker genes identified in DEGs are listed on the right. (D) Selected AD-related enrichment pathways in each cell type in the comparison between AD and control cells. (E) Underlying TFs are responsible for the cell-type-specific gene regulations identified by IRIS3.
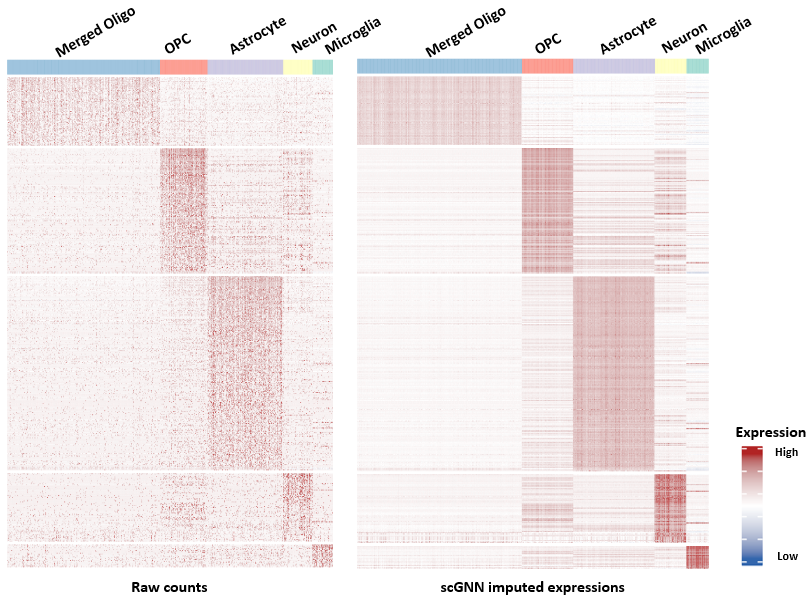
Figure S6. Comparison of DEG expression before (Left) and after scGNN imputation (Right). DEGs were identified using the Seurat package based on scGNN predicted clusters, and the six oligodendrocyte sub-clusters were merged into one. Cells were randomly selected from half of the merged oligo group to make the figure more balanced.